There's something in the air.
That's a given since the San Joaquin Valley is among the worst polluted air basins in the nation often coming in at either the worst or runner-up spot depending upon the particulate being measured.
However, the valley's notorious air quality reputation often masks the good news.
•Exceedances of the one-hour ozone standard continue to decline, from more than 50 in 2002 to just two in 2012.
•Ozone (smog) exceedances for the 1997 and 2008 8-hour standard have dropped by 55 percent and 34 percent, respectively, since 1992.
Those are just two of the points made in the San Joaquin Valley Air Pollution Control District's annual Report to the Community issued last week.
The district - formed in 1992 - acknowledges there is more work that needs to be done. At the same time, though, the annual report stressed a need to "see common-sense changes to the Federal Clean Air act.
"Our experience shows that many well-intentioned provisions are leading to unintended adverse consequences," the report states. "The antiquated provisions of the Clean Air act are now leading to confusion, and lack of an updated congressional directive has rendered courts as policy makers."
The district staff and governing board have reached a point where the failure of Washington, D.C., to take administrative and legislative action to update the Clean Air act is leading to the following:
•Chaotic and confusing transition to new standards.
•Standards and deadlines that are impossible to meet.
• Costly litigation leading to delays and confusion.
• Enormous administrative costs to state and local governments without any corresponding benefit to air quality.
• Enormous red-tape costs to businesses and individuals without any corresponding benefit to air quality.
One example of how standards are impossible to meet centers around nitrogen oxides.
The valley averages 625 tons of nitrogen oxides being released in the air on any given day. The new standard is to get it to 80 tons a day or less.
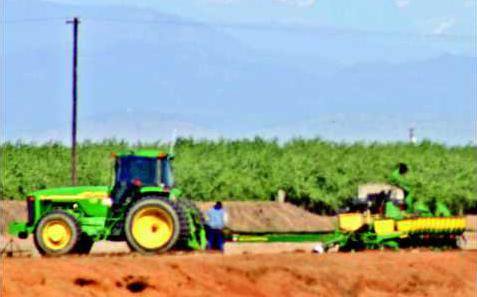
Heavy duty trucks account for about 250 tons daily. Passenger vehicles and off-road equipment each account for about 80 tons while off-road equipment is about another 70 tons. Other off-road sources such as trains account for around 30 tons. The balances - or nearly 120 tons - are from stationary and area sources that the district has control over establishing rules. Mobile sources generate 500 tons a day and are under state and federal regulations.
In short, you could stop all truck and vehicle traffic, suspend all train service, and idle all off-road and farm equipment and still not meet Environmental Protection Agency mandates.
Potential sanctions for failing to meet new federal air standards include banning new businesses from opening and preventing the expansion of existing businesses, losing all federal highway and federal takeover of the air quality control district.
Population in the valley has almost doubled since 1980 while emissions have been slashed by more than 50 percent.
The San Joaquin Valley during the past 10 years has:
• reduced emission from stationary sources by 83 percent.
• scored an 83 percent reduction in unhealthy days.
• recorded the cleanest winter on record in 2010 with only two unhealthy days.
• enjoyed the cleanest summer on record with over a 50 percent reduction in the number of times ozone levels exceeded standards by 8 hours or more.
The District in 2012 awarded about $100 million in grants and incentives to every sector of the Valley.
The 2012-13 Annual Report to the Community also contains updates and information on public health campaigns such as Healthy Air Living Schools; the introduction of smart-phone applications for immediate data access; new air-pollution research and its implications for the Valley; and District operations statistics.
The report is available online at http://www.valleyair.org/2012-13AnnualReport.pdf.